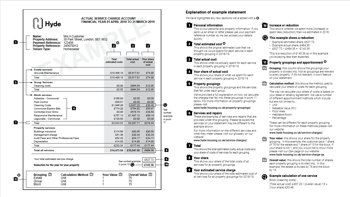
Your actual statement explained
As part of the service charge annual cycle our service charge estimates are sent out by the end of February each year and our service charge actual spend statements for the previous year are sent out by the end of September.
View our example service charge actual statement (PDF, 163KB) to help you understand it better. Click to enlarge.
Service charges pass to the purchaser. Therefore if you have bought your property this year, you will pay the last year’s service charges. This would have been set out in the details of your purchase and should have been explained by your solicitor.
- Personal information
This is your personal and property information. If you send us an email or letter please use your payment reference number so we can access your details quickly.
- Total estimated cost
This shows the original estimated cost that we thought we would spend for each service in each property grouping in 2019/20.
- Total actual cost
This shows what we actually spent for each service in each property grouping in 2019/20.
- Your share of actual cost
This shows your share of what we spent for each service in each property grouping in 2019/20.
- Property groupings
This shows the property groupings and the services that fall under each group. We’ve provided a full explanation on how we calculate the charges that fall into these groupings in point 11 below. For more information on property groupings please visit see the property groupings page.
- Services and repairs
These are examples of services and repairs that are provided under this grouping. Please be aware the services on your statement may be different to the example shown.
For more about the different services and what they mean please visit our full list of service charges (A-Z).
- Total
This shows the total estimated costs, actual costs and your share of costs of services for each grouping.
- Your share
This shows your share of the total costs of all services for all property groupings.
- Your estimated service charge
This shows your share of the total estimated cost of all services for all property groupings for 2019/20.
- Increase or reduction
This shows whether we spent more (increase) or spent less (reduction) than we estimated in 2019.
This example shows a reduction:
• Example estimated share: £627.72
• Example actual share: £484.36
• £627.72 – £484.36 = - £143.36
This is a reduction of £143.36 so in this example you’re paying less than expected.
- Property groupings and apportionment
11a. Grouping:
this column shows the groupings your property is divided into. Not all groupings are relevant to every property. If it’s not relevant, it won’t feature on your statement.
11b. Calculation method:
this shows the method used to calculate your share of costs for each grouping.
The way we calculate your share of costs is based on your lease or tenancy agreement. We use a number of different apportionment methods which include but are not limited to:
• Unit
• Rateable Value (RV)
• Floor Area
• Habitable Room
• Percentage
These can be different for each property grouping. For more information on these methods please see service charges.
11c. Your value:
this shows your share for the property grouping. In this example, the customer pays 1 share of 75 for the estate and 1 share of 15 for the block. If your share is not 1, and you would like to know more please visit our FAQ page.
11d. Overall value:
this shows the total number of shares each property grouping is divided into. In this example, the estate is divided by 75 and the block by 15.
Example calculation of one service
Block (cleaning costs)
(Total actual cost) £457.23 / (overall value) 15
= (Your share) £30.48

