Hyde currently employs approximately 1,300 people across London, the South East and Cambridgeshire. Our colleagues play a fundamental role in our vision to provide a great home for everyone, and we’re committed to building a more diverse and inclusive workforce that is reflective of the communities we serve.
This report looks at our current pay gaps and helps us identify the work we still need to do. The data provided is accurate as of April 2022.
Our results
The following calculations make up the information required for statutory reporting.
Median
The median shows the difference between the middle paid woman and middle paid man.
Our median gender pay gap is: 4.9% (lower for women)
Mean
The mean shows the difference in average hourly pay between men and women.
Our mean gender pay gap is: 11.7% (lower for women)
Pay quartiles
This is where all the salaries are sorted by size and divided into equal quarters. The pie charts below show how men and women are spread throughout the organisation by hourly pay, from lowest to highest:
The lower quartile is made up of 59% females and 41% males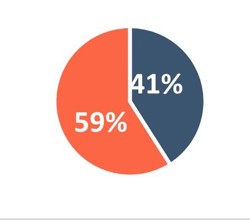
The lower middle quartile is made up of 60% females and 40% males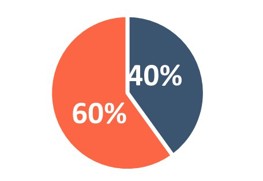
The upper middle quartile is made up of 54% females and 46% males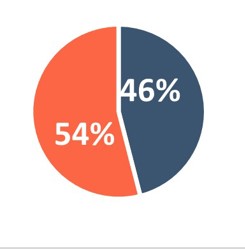
The upper quartile is made up of 43% females and 57% males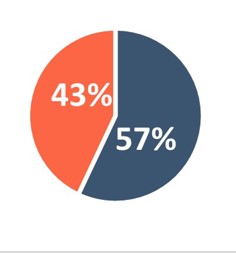
Gender bonus pay gap
Our median gender bonus gap is 0%.
Our mean gender bonus gap is 12.9%.
The proportion of colleagues who receive a bonus is:
|
Male |
Female |
|
87.0% |
92.7% |
Understanding our gender pay and bonus gap
We've seen a slight increase in our median gender pay gap from 4.7% to 4.9% since the 2021 reporting date. In the same period Hyde’s mean gender pay gap has decreased by 3.3% to 11.7%. The proportion of women at the most senior grades increased slightly between the 2021 and 2022 reporting dates.
Hyde continues to have a gender pay gap and our analysis indicates that this remains due to females being under-represented at the more senior levels and not from men and women being paid differently for the same or equivalent work. If there was an equal proportion of men and women at each Hyde level then the mean gender pay gap would fall from 11.7% to 0.8% which amplifies the imperative to ensure representation at all levels of the organisation.
The median gender bonus gap remains at 0% and the mean gender bonus gap shows that women are paid 12.9% less than men (a significant fall since last year). The mean bonus gap is being driven by the higher proportion of men in the senior levels who participate in the senior leaders bonus which is a higher percentage of salary. In addition, the mean gender bonus gap change is being driven by the absence this year of the Frontline Covid Hero Payment which distorted figures last year.
Our ethnicity pay gap
It isn't currently mandatory to measure the ethnicity pay gap, however, in the spirit of transparency, we have been sharing these calculations since 2018.
We have used the same calculation principles as the gender pay reporting and excluded colleagues who have decided not to share their ethnicity.
Our median ethnicity pay gap is: 4.1% (lower for ethnically diverse colleagues)
Our mean ethnicity pay gap is: 14.5% (lower for ethnically diverse colleagues)
Pay quartiles
The pie charts below show how white and ethnically diverse colleagues are spread throughout the organisation by hourly pay, from lowest to highest (this excludes those where ethnicity is not stated).
The lower quartile is made up of 67% white and 33% ethnically diverse colleagues 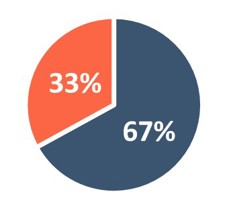
The lower middle quartile is made up of 68% white and 32% ethnically diverse colleagues 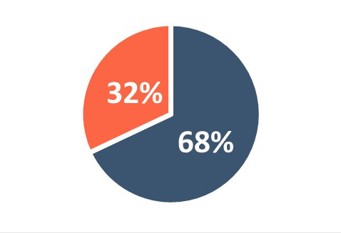
The upper middle quartile is made up of 66% white and 34% ethnically diverse colleagues 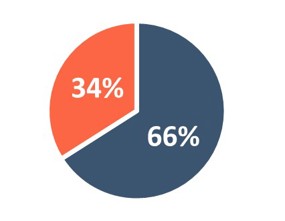
The upper quartile is made up of 76% white and 24% ethnically diverse colleagues 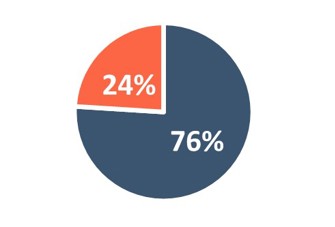
Return to top
Ethnicity bonus pay gap
Our median ethnicity bonus gap is 0%.
Our mean ethnicity bonus gap is 42.0%.
The proportion of employees who receive a bonus is:
|
White |
Black, Asian and other ethnic minorities |
|
93.3% |
83.7% |
Understanding our ethnicity pay and bonus gap
We have also seen a slight increase in our median ethnicity pay gap but a decrease in the mean. Hyde’s median ethnicity pay gap has increased by 0.6% to 4.1% and the mean has decreased by 2.2% to 14.5% since the 2021 reporting date.
Our results show that ethnically diverse colleagues make up 30% of our workforce, yet we have proportionally fewer ethnically diverse colleagues in the higher paid senior roles, with only 12.2% of Heads of Service, Directors and the C-Suite being ethnically diverse. Although this is an increase of 1.1% since 2021. It is this under-representation at the more senior levels that is a key factor in Hyde’s ethnicity pay gap.
The median ethnicity bonus gap remains at 0% and the mean ethnicity bonus gap shows that ethnically diverse colleagues are paid 42% less than white colleagues, a decrease of 2.9% since the 2021 reporting date. If we exclude senior colleagues from this calculation the ethnicity bonus gap would fall to 9.2%. This clearly shows the mean bonus gap is being driven by the higher proportion of white colleagues in the senior levels who participate in the senior leaders bonus which is a higher percentage of salary.
How we’re looking to close our gender and ethnicity pay gaps
Since reporting in 2022, we've undertaken several activities that focus on closing the gender and ethnicity pay gaps:
- Continued to encourage that all shortlists for senior roles contain a mix of male and female candidates and are as diverse as possible (the Rooney rule);
- Continued to check for any bias in the performance review ratings of women and ethnically diverse colleagues;
- In line with our strategic aim to ensure that diversity of our senior leaders better reflects our overall workforce demographic, women and ethnically diverse colleagues within the talent pool have been provided with specifically tailored input on their development options to support their career aspirations;
- Implemented an applicant tracking system to enable monitoring and reporting on application, interview and appointment data by gender and ethnicity (along with other protected characteristics);
- Continued requirement for diverse interview panels with a pool of 20 ethnically diverse colleagues who are available to join panels where there is no ethnically diverse representative; and
- Continued with three KPIs to support closing of pay gaps:
- % of senior female managers compared to % of female colleagues;
- % of ethnically diverse senior managers compared to % of ethnically diverse colleagues
- % of ethnically diverse middle and 1st line managers compared to % of ethnically diverse colleagues.
Diversity and inclusion are a key focus of our 2020-25 People and Culture Strategy, with clear objectives to ensure that we're building a diverse and inclusive workforce at all levels of the organisation in order to meet the diverse needs of our customers and communities.
In order to support these objectives, we've recruited our first senior level Diversity and Inclusion Lead whose role will be dedicated to planning our inclusion strategy. In addition, as part of our work with the G15 and renewal of the G15 ethnicity pledge, we're committed to increasing the number of ethnically diverse colleagues at senior and board level, and we're developing additional career pathways for ethnically diverse colleagues.
Our Chair has also signed up to the NHF Chair’s Challenge, a public commitment to create a vision for our Board to become more equal, diverse and inclusive and, in particular, this will commit us to continuing to adopt an inclusive approach to recruitment including using the Rooney rule to ensure diverse shortlists.

Andy Hulme
Chief Executive Officer
Return to top