Listening to our customers to shape better services
We’re committed to listening to customers about what they think about our services, so we can continue to improve. Our annual Tenant Satisfaction Measures (TSMs) are a way for customers to provide feedback and to understand our performance.
These surveys are different to other satisfaction surveys, where we ask for feedback from customers after they’ve received a service from us.
Tenant Satisfaction Measures (TSMs)
There are 24 TSMs, set by the Regulator of Social Housing.
All housing providers registered with the RSH must collect and publish this information every year.
Twelve of the measures cover customer satisfaction with services and are based on customer surveys. The other twelve focus on our operational performance, including building safety compliance checks, as well as how we manage complaints and antisocial behaviour.
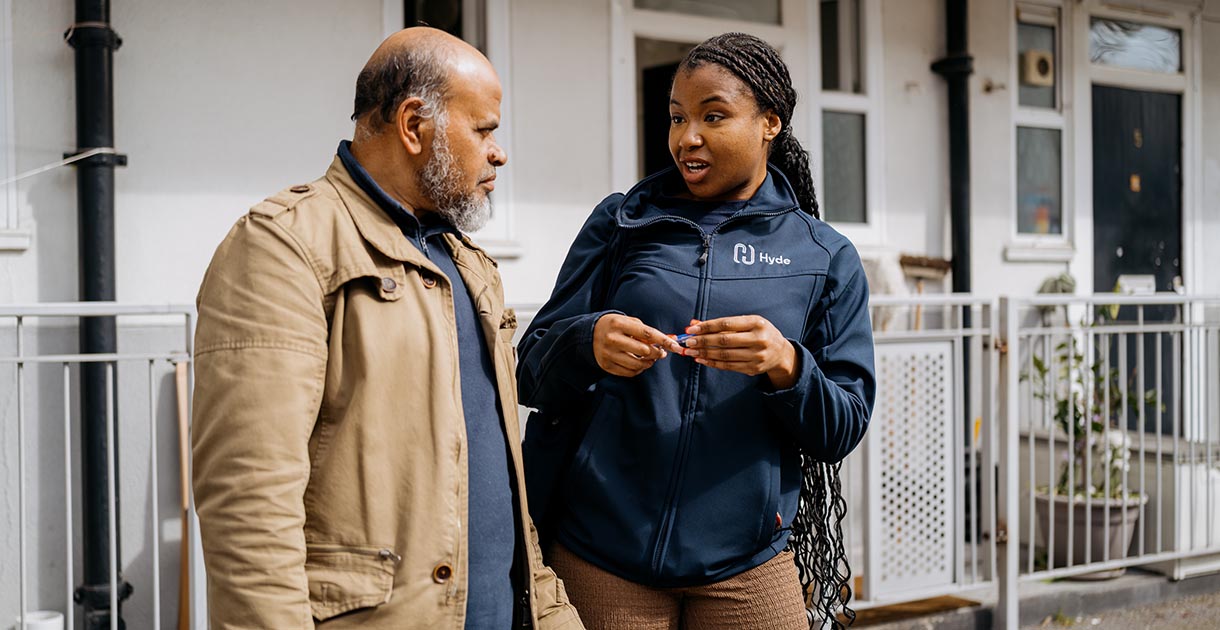
Customer surveys were carried out during the 2025/26 financial year by In-house Research, an independent research company, which asked a representative sample of our tenants and shared owners their opinions on how we repair and maintain homes, whether we listen and respond to their feedback, and their overall satisfaction with the services we provide.
We publish the results for tenants and shared owners as separate figures. As well as publishing them here, we publish our TSMs in our Annual Report and in our Annual Review for Customers, and in a range of formats, so they’re accessible to everyone.
John Carmichael, Chief Risk and Governance Officer, is responsible for ensuring we comply with the consumer standards set by the Regulator of Social Housing, which the TSMs are part of.
Who we survey
The Regulator of Social Housing requires us to survey a representative sample of our tenants living in ‘low-cost rental accommodation’ (including general needs, affordable rent, independent living, supported housing, intermediate rent and temporary social housing) and those living in ‘low-cost home ownership’ (shared owners).
Our TSMs for 2025/26 are based on surveys of customers from all registered providers in the Hyde Group, including Tower Hamlets Community Housing and those owned by Pinnacle Group.
For a landlord of our size, we’re required to survey 2,225 tenants and 521 shared owners. In 2025/26 we actually surveyed 2,448 tenants and 579 shared owners.
| Telephone | Online | Face-to-face | Total | |
| Tenants | 2,097 | 81 | 270 | 2,448 |
| Shared owners | 502 | 5 | 72 | 579 |
| Total | 2,599 | 86 | 342 | 3,027 |
Surveys were carried out during the 2025/26 financial year by In-house Research, an independent research company, and Hyde colleagues.
Tenants and shared owners are asked their opinions on how we repair and maintain homes, whether we listen and respond to their feedback, and their overall satisfaction with the services we provide.
Customers not included in the reported TSM scores
Leaseholders: Leaseholders’ homes are managed according to the terms of their lease and are not regulated by the Regulator of Social Housing. However, we collected 350 TSM-like surveys with a representative sample of leaseholders, to ensure we understand their needs and satisfaction levels.
Agency-managed supported housing customers, who needed an ‘easy-read’ version of the survey. We carried out a separate easy read survey of these customers, investigating satisfaction levels on similar service areas of our main TSMs.
Some households were excluded, so that surveys didn’t interfere with sensitive or ongoing situations:
| Open disrepair case | 324 |
| Deceased | 232 |
| Open antisocial behaviour case | 81 |
| Open complaint case | 75 |
Read our methodology (PDF, 137KB); download the questionnaire (PDF, 170KB) and visit our FAQs page for more details.
Our performance in 2025/26
Overall satisfaction
We maintained tenants’ and shared owners’ overall satisfaction this year, as we continue to invest in long term customer outcomes, with a focus on improving our services. In 2025/26, 65.5% of tenants were satisfied with services (2024/25: 65.5%) and 41.2% of shared owners were satisfied with services (2024/25: 41.1%).
We continued to make improvements to customer services; our Customer Services Centre handled calls faster and resolved more queries in the first call. Team members are, on average, speaking to five customers an hour, 20% more than last year, as call abandonment rates (those customers who were unable to wait to speak to one of our team) pleasingly continued to fall.
Take up of MyAccount grew this year, as we expanded the range of services available on our digital platform, making it easier for customers to manage their home themselves.
We launched our Homeowner Service Centre on 1 April 2026, to support homeowners’ specific needs. Calls to our Customer Services Centre will be automatically routed to homeowner officers, who are trained to handle homeowner queries at the first point of contact, including communal repairs, ASB reports and lease enquiries.
Maintaining homes, keeping them in good repair and ensuring they’re safe
Tenants’ satisfaction with repairs and maintenance increased this year, to 71.1% (2024/25: 67.9%). They were also more satisfied with the time taken to carry out a repair (72.4%, compared to 67.9% in 2024/25) and 68.5% were satisfied their home was well maintained (2024/25: 66.9%).
Our new SMS service means customers can find out more information about their repairs and maintenance appointments. Customers receive a text message when we’re on our way, with a link to details about the timeslot, the operative’s name and their van registration, and what work they’ll be carrying out.
We completed more than 7,000 stock condition surveys of our homes in 2025/26, including nearly 1,800 blocks. This means that 96% of our homes have been surveyed in the last five years. Stock condition surveys enable us to assess the condition of key components in a home (including kitchens, bathrooms and windows) and support our planned maintenance programme. In 2025/26 we spent £132.1m on maintaining, repairing and improving customers’ homes.
Customers’ satisfaction that their home is safe fell slightly this year, with 72.9% of tenants being satisfied (2024/25: 76.4%) and 62.1% of shared owners being satisfied (2024/25: 63.2%).
All of the buildings we own or manage have had a fire Risk assessment and, at the year end, only 75 actions were outstanding. This compares to 1,560 outstanding actions at the beginning of the year, including 461 in buildings formerly managed by Tower Hamlets Community Housing.
Listening to tenants and acting and informing them, treat them with respect
Our Customer Involvement team focused on fewer, more meaningful customer engagement activities in 2025/26, to ensure customers could directly influence decisions, policies and service improvements. This was in additional to local and neighbourhood engagement (for example, drop-in events, consultations and other neighbourhood activities), which is led by operational teams.
We continued to work with Customer Voice, our most senior customer group, to ensure it’s an effective forum, introducing new voices and strengthening the quality of challenge and insight.
This year, customers helped us to improve aspects of our services, including: service adjustments for vulnerabilities; mutual exchange; damp, mould and condensation; mobility scooter management; service charges; and energy retrofitting of homes.
Both tenants: 66.5% (2024/25: 65.8%) and shared owners: 41% (2024/25: 35.3%), were more satisfied that we listened to them and acted on their feedback last year. They were also more satisfied that we informed them about the things that mattered to them: 71.2% of tenants were satisfied (2024/25: 69.7%) and 57.6% of shared owners were satisfied (2024/25: 53.0%).
Additionally, 73.7% of tenants (2024/25: 72.4%) and 53.3% of shared owners (2024/25: 50.8%) agreed that we treat them fairly and with respect, improving our performance on the previous year.
Managing complaints
Like most of the sector, satisfaction with how we handle complaints remains our weakest area, particularly for shared owners. Tenants’ satisfaction with how we handle their complaints decreased slightly this year, from 37.1% to 34%, while shared owners’ satisfaction decreased from 19.8% to 19%.
We continue to work hard to improve this area of our service and reduced response times through better customer communication and more thorough investigations in 2025/26. Internal audits, monitoring, and spotlight reports highlighting trends in complaints, are helping us further improve our approach. We received fewer negative outcomes in determinations received from the Housing Ombudsman relating to our complaint handling for 2025/26 then we have for any other year.
Keeping communal areas clean and well-maintained
While satisfaction that we keep communal areas clean and well-maintained fell very slightly this year (tenants: 63.2% (2024/25: 64.4%); shared owners: 47.7%, (2024/25: 48.3%), we expect satisfaction to increase now Pinnacle Group is responsible for our ground maintenance services and communal cleaning services.
Pinnacle won both contracts after a competitive process in November 2025. We now have a joined-up approach, covering most of our neighbourhoods, that will be more efficient, deliver better value for money and mean higher quality services and great living environments for customers.
Managing our neighbourhoods
When it comes to managing our neighbourhoods, 58.6% of tenants (2024/25: 61.1%) and 35.1% (2024/25: 37.3%) of shared owners said we made a positive contribution to their neighbourhood. During the same period, satisfaction with how we handled antisocial behaviour also decreased slightly, 59.5% for tenants (2024/25: 58.0%) and 34.6% for shared owners (2024/25: 33.2%).
We’re committed to making our communities safe and pleasant places to live and recognise there’s more we can do. We’ve made changes to how we manage our neighbourhoods this year, based on what customers told us would make the biggest difference.
Our Antisocial Behaviour, Tenancy and Neighbourhoods teams have been combined to create one team, to give clear ownership, quicker action when issues arise and a more joined-up service when customers need support. We’ve also strengthened the specialist support behind the team, to help deal with complex issues relating to antisocial behaviour, vulnerability and tenancy fraud.
Customers will now be supported by a neighbourhood officer and a tenancy management officer. Neighbourhood officers are responsible for making sure communal spaces and buildings stay safe and compliant; tenancy management officers focus on tenancy‑related needs and antisocial behaviour cases.
Our Tenant Satisfaction Measures in 2025/26
Customer satisfaction
By gathering feedback from tenants and shared owners, we can continuously improve our services, from overall satisfaction to repairs. The Tenant Satisfaction Measures also allow customers to compare our performance with that of other providers.
Overall satisfaction with our services
Tenants (2024/25: 65.5%)
Shared owners (2024/25: 41.1%)
Satisfaction with repairs
Overall satisfaction with repairs - Tenants (2024/25: 67.9%)
Satisfaction with time taken to complete the most recent repair - Tenants (2024/25: 67.9%)
Satisfaction that the home is well maintained - Tenants (2024/25: 66.9%)
Satisfaction that the home is safe
Tenants (2024/25: 76.4%)
Shared owners (2024/25: 63.2%)
Satisfaction that we listen to tenants' views and act upon them
Tenants (2024/25: 65.8%)
Shared owners (2024/25: 35.3%)
Satisfaction that we keep tenants informed about things that matter to them
Tenants (2024/25: 69.7%)
Shared owners (2024/25: 53.0%)
Agreement that we treat tenants fairly and with respect
Tenants (2024/25: 72.4%)
Shared owners (2024/25: 50.8%)
Satisfaction with how we handle complaints
Tenants (2024/25: 37.1%)
Shared owners (2024/25: 19.8%)
Satisfaction that we keep communal areas clean and well-maintained
Tenants (2024/25: 64.4%)
Shared owners (2024/25: 48.3%)
Satisfaction that we make a positive contribution to the neighbourhood
Tenants (2024/25: 61.1%)
Shared owners (2024/25: 37.3%)
Satisfaction with how we handle antisocial behaviour
Tenants (2024/25: 58.0%)
Shared owners (2024/25: 33.2%)
Building safety and compliance
Building safety and compliance are key Tenant Satisfaction Measures. We're committed to meeting high standards, with near-perfect completion rates for fire, gas, asbestos, and legionella checks, as well as maintaining the Decent Homes Standard.
Homes requiring a gas safety check that have had one completed (2024/25: 100%)
Homes requiring a fire risk assessment that have had one completed (2024/25: 100%)
Homes requiring an asbestos check that have had one completed (2024/25: 100%)
Homes requiring a legionella check that have had one completed (2024/25: 100%)
Buildings with passenger lifts that have had a lift safety check (2024/25: 100%)
Homes not meeting the Decent Homes Standard (2024/25: 1.1%)
Repairs, complaints and antisocial behaviour
Repairs
Proportion of repairs completed within target timescale
Non-emergency (rented homes) (2024/25: 84.8%
Emergency (rented homes) (2024/25: 99.5%)
Non emergency repairs targets:
Hyde aims to complete routine repairs within 20 working days. It aims to complete non-urgent repairs outside of homes within 120 working days.
Pinnacle Group aims to attend urgent repairs within five working days and complete repairs within 21 working days. It aims to attend non-urgent repairs within 21 working days and complete repairs within 60 working days
Emergency repairs targets:
We aim to carry out emergency repairs (or make safe) within 24 hours.
Pinnacle Group aims to attend emergency repairs within 24 hours and complete repairs within 14 working days.
Stage 1 complaints
received per 1,000 homes
Stage 1 complaints received per 1,000 rented homes (2024/25: 99.7)
Stage 1 complaints received per 1,000 shared ownership homes (2024/25: 94.5)
Stage 2 complaints
received per 1,000 homes
Stage 2 complaints received per 1,000 rented homes (2024/25: 30.9)
Stage 2 complaints received per 1,000 shared ownership homes (2024/25: 35)
Stage 1 complaints
responded to within the Housing Ombudsman’s Complaint handling code timescales
Tenants (2024/25: 91.9%)
Shared owners (2024/25: 89.7%)
Stage 2 complaints
responded to within the Housing Ombudsman’s Complaint handling code timescales
Tenants (2024/25: 90.9%)
Shared owners (2024/25: 91.2%)
Antisocial behaviour
cases opened per 1,000 homes
(2024/25: 60.8)
Antisocial behaviour cases
involving hate incidents per 1,000 homes
(2024/25 1.1)